Debugging
Built-in Developer Tools
Flipper runs in the Browser. This means you can debug Flipper using any web developer tools like Chrome's Developer Tools.
In addition, to assist you with the JavaScript, the JS console displays uncaught exceptions thrown from the client plugin in response to Flipper method calls.
Google Chrome Developer Tools
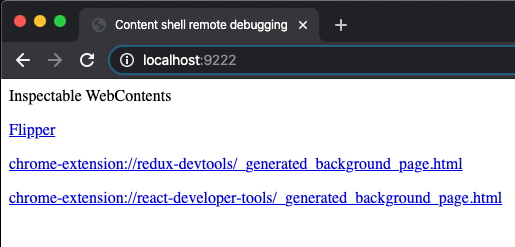
As an alternative to using built-in Developer Tools, you can also attach to the running Flipper instance from Google Chrome Developer Tools. Sometimes this is useful because the version of Dev Tools in Google Chrome is more recent than the embedded one, and it is possible to easily install additional extensions if required.
To attach the running Flipper instance, open a new tab in Google Chrome, navigate to http://localhost:9222 and choose 'Flipper' in the opened list, as shown in the following screenshot
Visual Studio Code
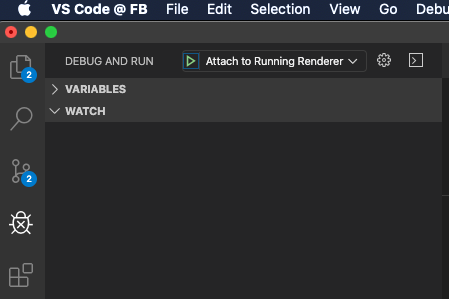
If you prefer to use the same editor for both coding and debugging, you can attach to the running Flipper instance for debugging right from Visual Studio Code. Take the following steps:
- First, you need to install the extension 'Debugger for Chrome'.
- To start debugging, open the folder
desktopof the Flipper repository in VSCode - Execute
yarn startin a terminal to launch Flipper in development mode - Select tab
Debug and Runand run taskAttach to Running Renderer. By default, this task is set as the first one, so you can just pressF5to run it.
Plugin missing
If a plugin you've created is not showing up, there might be two potential classes of problems, either there is a problem on the mobile side or on the desktop side (understanding where the problem is rooted helps in debugging it).
Click on 'Plugin now showing' in the sidebar and see if your plugin is now listed. If it is not listed, the desktop side of the plugin is not loaded. One of the main reasons for this is that the plugin could not be compiled, due to some errors. Try launching Flipper from the Terminal to see some additional logs: /Applications/Flipper.app/Contents/MacOS/Flipper.
A common error here is Error: fsevents unavailable (this watcher can only be used on Darwin). This can be fixed by installing watchman (brew install watchman).
Print debugging
Add console.log("test phrase %", object) and then search the developer tools log in Flipper to find what the value of the object is. If the plugin is listed in the desktop app, but still is not showing up in the sidebar, the mobile app is not announcing the plugin. In this case, make sure to instantiate your plugin and add it to your FlipperClient.